J.T. Compher
Explore projections, stats, news, player usage charts, and line combinations for members of the Detroit Red Wings
-
Left Wing Leaders
2023 - 2024
Name G A Pts Artemi
Panarin49 71 120 Kirill Kaprizov 46 50 96 Filip Forsberg 48 46 94 Matthew Tkachuk 26 62 88 Jesper Bratt 27 56 83 Jason Robertson 29 51 80 Zach Hyman 54 23 77 Chris Kreider 39 36 75 Brandon Hagel 26 49 75 Brady Tkachuk 37 37 74 Kevin Fiala 29 44 73 Lucas Raymond 31 41 72 -
Player Card

J.T. Compher
Detroit Red Wings2023 - 2024- G 19
- A 29
- PTS 48
- +/- -5
- PIM 34
- PPP 10
- SH% 17.6
- L 0%
- C 99%
- R 1%
-
Detroit Red Wings Leaders
2023 - 2024
Name G A Pts Lucas
Raymond31 41 72 Dylan Larkin 33 36 69 Alex DeBrincat 27 40 67 Shayne Gostisbehere 10 46 56 J.T. Compher 19 29 48 Patrick Kane 20 27 47 David Perron 17 30 47 Daniel Sprong 18 25 43 Moritz Seider 9 33 42 Andrew Copp 13 20 33 Michael Rasmussen 13 20 33 Robby Fabbri 18 14 32
News
-
J.T. Compher
Is sick. His status for Thursday's game is not known at this time.
Jan 24, 2024 - 12:45 pm -
J.T. Compher
Has been activated from IR.
Dec 16, 2023 - 12:26 pm -
J.T. Compher
Is expected to play in Saturday's game.
Dec 15, 2023 - 1:45 pm -
J.T. Compher
Will not play in tonight's game against the Carolina Hurricanes. He hopes to return to game action by Saturday.
Dec 14, 2023 - 11:22 am
Feature
-
Trending
Buy-Low and Sell-High: Skaters
Replies 0
Basic Stats
| Season | Team | GP | G | A | P | +/- | PIM | S | S/GP | SH% | PPP | H | BS | FW | FO% | TOI | EVTOI | PPTOI | PKTOI |
|---|---|---|---|---|---|---|---|---|---|---|---|---|---|---|---|---|---|---|---|
| 23-24 | DET | 77 | 19 | 29 | 48 | -5 | 34 | 108 | 1.4 | 17.6 | 10 | 51 | 59 | 465 | 44.8 | 19.39 | 14.41 | 2.51 | 2.46 |
| 22-23 | COL | 82 | 17 | 35 | 52 | 8 | 33 | 154 | 1.9 | 11.0 | 14 | 37 | 82 | 813 | 48.8 | 20.54 | 15.64 | 2.77 | 2.13 |
| 21-22 | COL | 70 | 18 | 15 | 33 | 6 | 25 | 102 | 1.5 | 17.7 | 6 | 31 | 55 | 338 | 51.5 | 16.32 | 12.86 | 1.80 | 1.67 |
| 20-21 | COL | 48 | 10 | 8 | 18 | 10 | 19 | 47 | 1 | 21.3 | 2 | 32 | 38 | 216 | 45.9 | 14.22 | 10.59 | 1.37 | 2.26 |
| 19-20 | COL | 67 | 11 | 20 | 31 | 9 | 18 | 106 | 1.6 | 10.4 | 5 | 36 | 60 | 341 | 47.7 | 16.75 | 12.44 | 2.05 | 2.26 |
Enhanced Stats (5-on-5 unless denoted with *)
| Season | G/60 | A/60 | P/60 | IPP | ΔPEN/60 | 1A | 2A | EVS/60* | PPS/60* | SATF | SAT% | tEVSH% | tEVSV% | SHSV | ZS% |
|---|---|---|---|---|---|---|---|---|---|---|---|---|---|---|---|
| 23-24 | 0.58 | 1.16 | 1.75 | 67 | 0.20 | 14 | 6 | 3.8 | 9.6 | 910 | 44.8 | 11.0 | 0.906 | 1016 | 44.3 |
| 22-23 | 0.61 | 0.91 | 1.51 | 61 | 0.04 | 11 | 7 | 5.3 | 8.7 | 1175 | 51.0 | 7.5 | 0.935 | 1010 | 49.1 |
| 21-22 | 0.79 | 0.50 | 1.29 | 53 | 0.16 | 4 | 3 | 5.7 | 6.7 | 779 | 48.5 | 8.5 | 0.942 | 1027 | 43.5 |
| 20-21 | 1.11 | 0.74 | 1.85 | 58 | 0.09 | 3 | 3 | 4.4 | 7.3 | 452 | 53.9 | 10.6 | 0.942 | 1048 | 38.5 |
| 19-20 | 0.69 | 0.92 | 1.60 | 62 | 0.59 | 7 | 5 | 5.7 | 10.5 | 684 | 47.1 | 9.6 | 0.938 | 1034 | 44.4 |
Regression Meter
This meter measures whether or not a player's point production is being influenced by luck. Orange indicates the player has been lucky. Dark grey indicates the player has been unlucky.
2A/60
tEVSH%
SH%
IPP
PPSH%
Positional Data
| Season | Team | Left | Center | Right |
|---|---|---|---|---|
| 23-24 | DET | 0 | 99 | 1 |
| 22-23 | COL | 0 | 100 | 0 |
| 21-22 | COL | 20 | 42 | 38 |
| 20-21 | COL | 31 | 47 | 22 |
| 19-20 | COL | 3 | 42 | 55 |
Most Common Linemates and Line Production
See also: Detroit Red Wings Line Combo Tool | Line Production Tool
| Team | F1 | F2 | F3 | GF | GA | GF% | SATF | SATA | SAT% | USATF | USATA | USAT% | SH% | SV% | SHSV | ZS% |
|---|---|---|---|---|---|---|---|---|---|---|---|---|---|---|---|---|
| DET | COMPHER | KANE | DEBRINCAT | 8 | 8 | 50.0 | 175 | 199 | 46.8 | 117 | 139 | 45.7 | 9.9 | 0.915 | 1014 | 50.0 |
| DET | COMPHER | RASMUSSEN | RAYMOND | 3 | 2 | 60.0 | 66 | 71 | 48.2 | 42 | 46 | 47.7 | 11.1 | 0.931 | 1042 | 24.0 |
| DET | COMPHER | DEBRINCAT | RAYMOND | 4 | 1 | 80.0 | 60 | 91 | 39.7 | 44 | 59 | 42.7 | 12.9 | 0.976 | 1105 | 38.5 |
Most Recent 10 Games
| OPP | G | A | P | +/- | PIM | SOG | SH% | H | BS | FW | FL | FO% | TOI | EVTOI | PPTOI | PKTOI | ID |
|---|---|---|---|---|---|---|---|---|---|---|---|---|---|---|---|---|---|
| MTL | 0 | 0 | 0 | -1 | 0 | 0 | 0 | 0 | 1 | 4 | 8 | 33 | 16:20 | 13:36 | 00:00 | 02:44 | 21298 |
| MTL | 2 | 0 | 2 | 0 | 0 | 4 | 50 | 1 | 0 | 10 | 7 | 59 | 19:59 | 19:04 | 00:55 | 00:00 | 21287 |
| TOR | 0 | 2 | 2 | 1 | 0 | 1 | 0 | 2 | 3 | 9 | 7 | 56 | 18:25 | 13:21 | 01:14 | 03:50 | 21277 |
| PIT | 0 | 1 | 1 | -2 | 0 | 3 | 0 | 0 | 1 | 7 | 8 | 47 | 21:53 | 17:43 | 02:27 | 01:43 | 21258 |
| WSH | 0 | 0 | 0 | -2 | 0 | 3 | 0 | 1 | 2 | 3 | 7 | 30 | 17:54 | 16:28 | 00:00 | 01:26 | 21240 |
| BUF | 0 | 0 | 0 | 0 | 0 | 0 | 0 | 1 | 0 | 3 | 10 | 23 | 20:41 | 18:53 | 00:14 | 01:34 | 21228 |
| NYR | 1 | 0 | 1 | 0 | 0 | 3 | 33.3 | 1 | 2 | 13 | 7 | 65 | 19:17 | 15:51 | 01:09 | 02:17 | 21213 |
| TBL | 0 | 2 | 2 | 3 | 0 | 2 | 0 | 0 | 1 | 10 | 10 | 50 | 23:01 | 15:18 | 04:11 | 03:32 | 21184 |
| FLA | 0 | 0 | 0 | 0 | 0 | 1 | 0 | 0 | 2 | 7 | 2 | 78 | 21:22 | 15:56 | 03:59 | 01:27 | 21165 |
| CAR | 0 | 0 | 0 | 0 | 0 | 0 | 0 | 1 | 2 | 7 | 5 | 58 | 18:20 | 14:19 | 02:54 | 01:07 | 21150 |
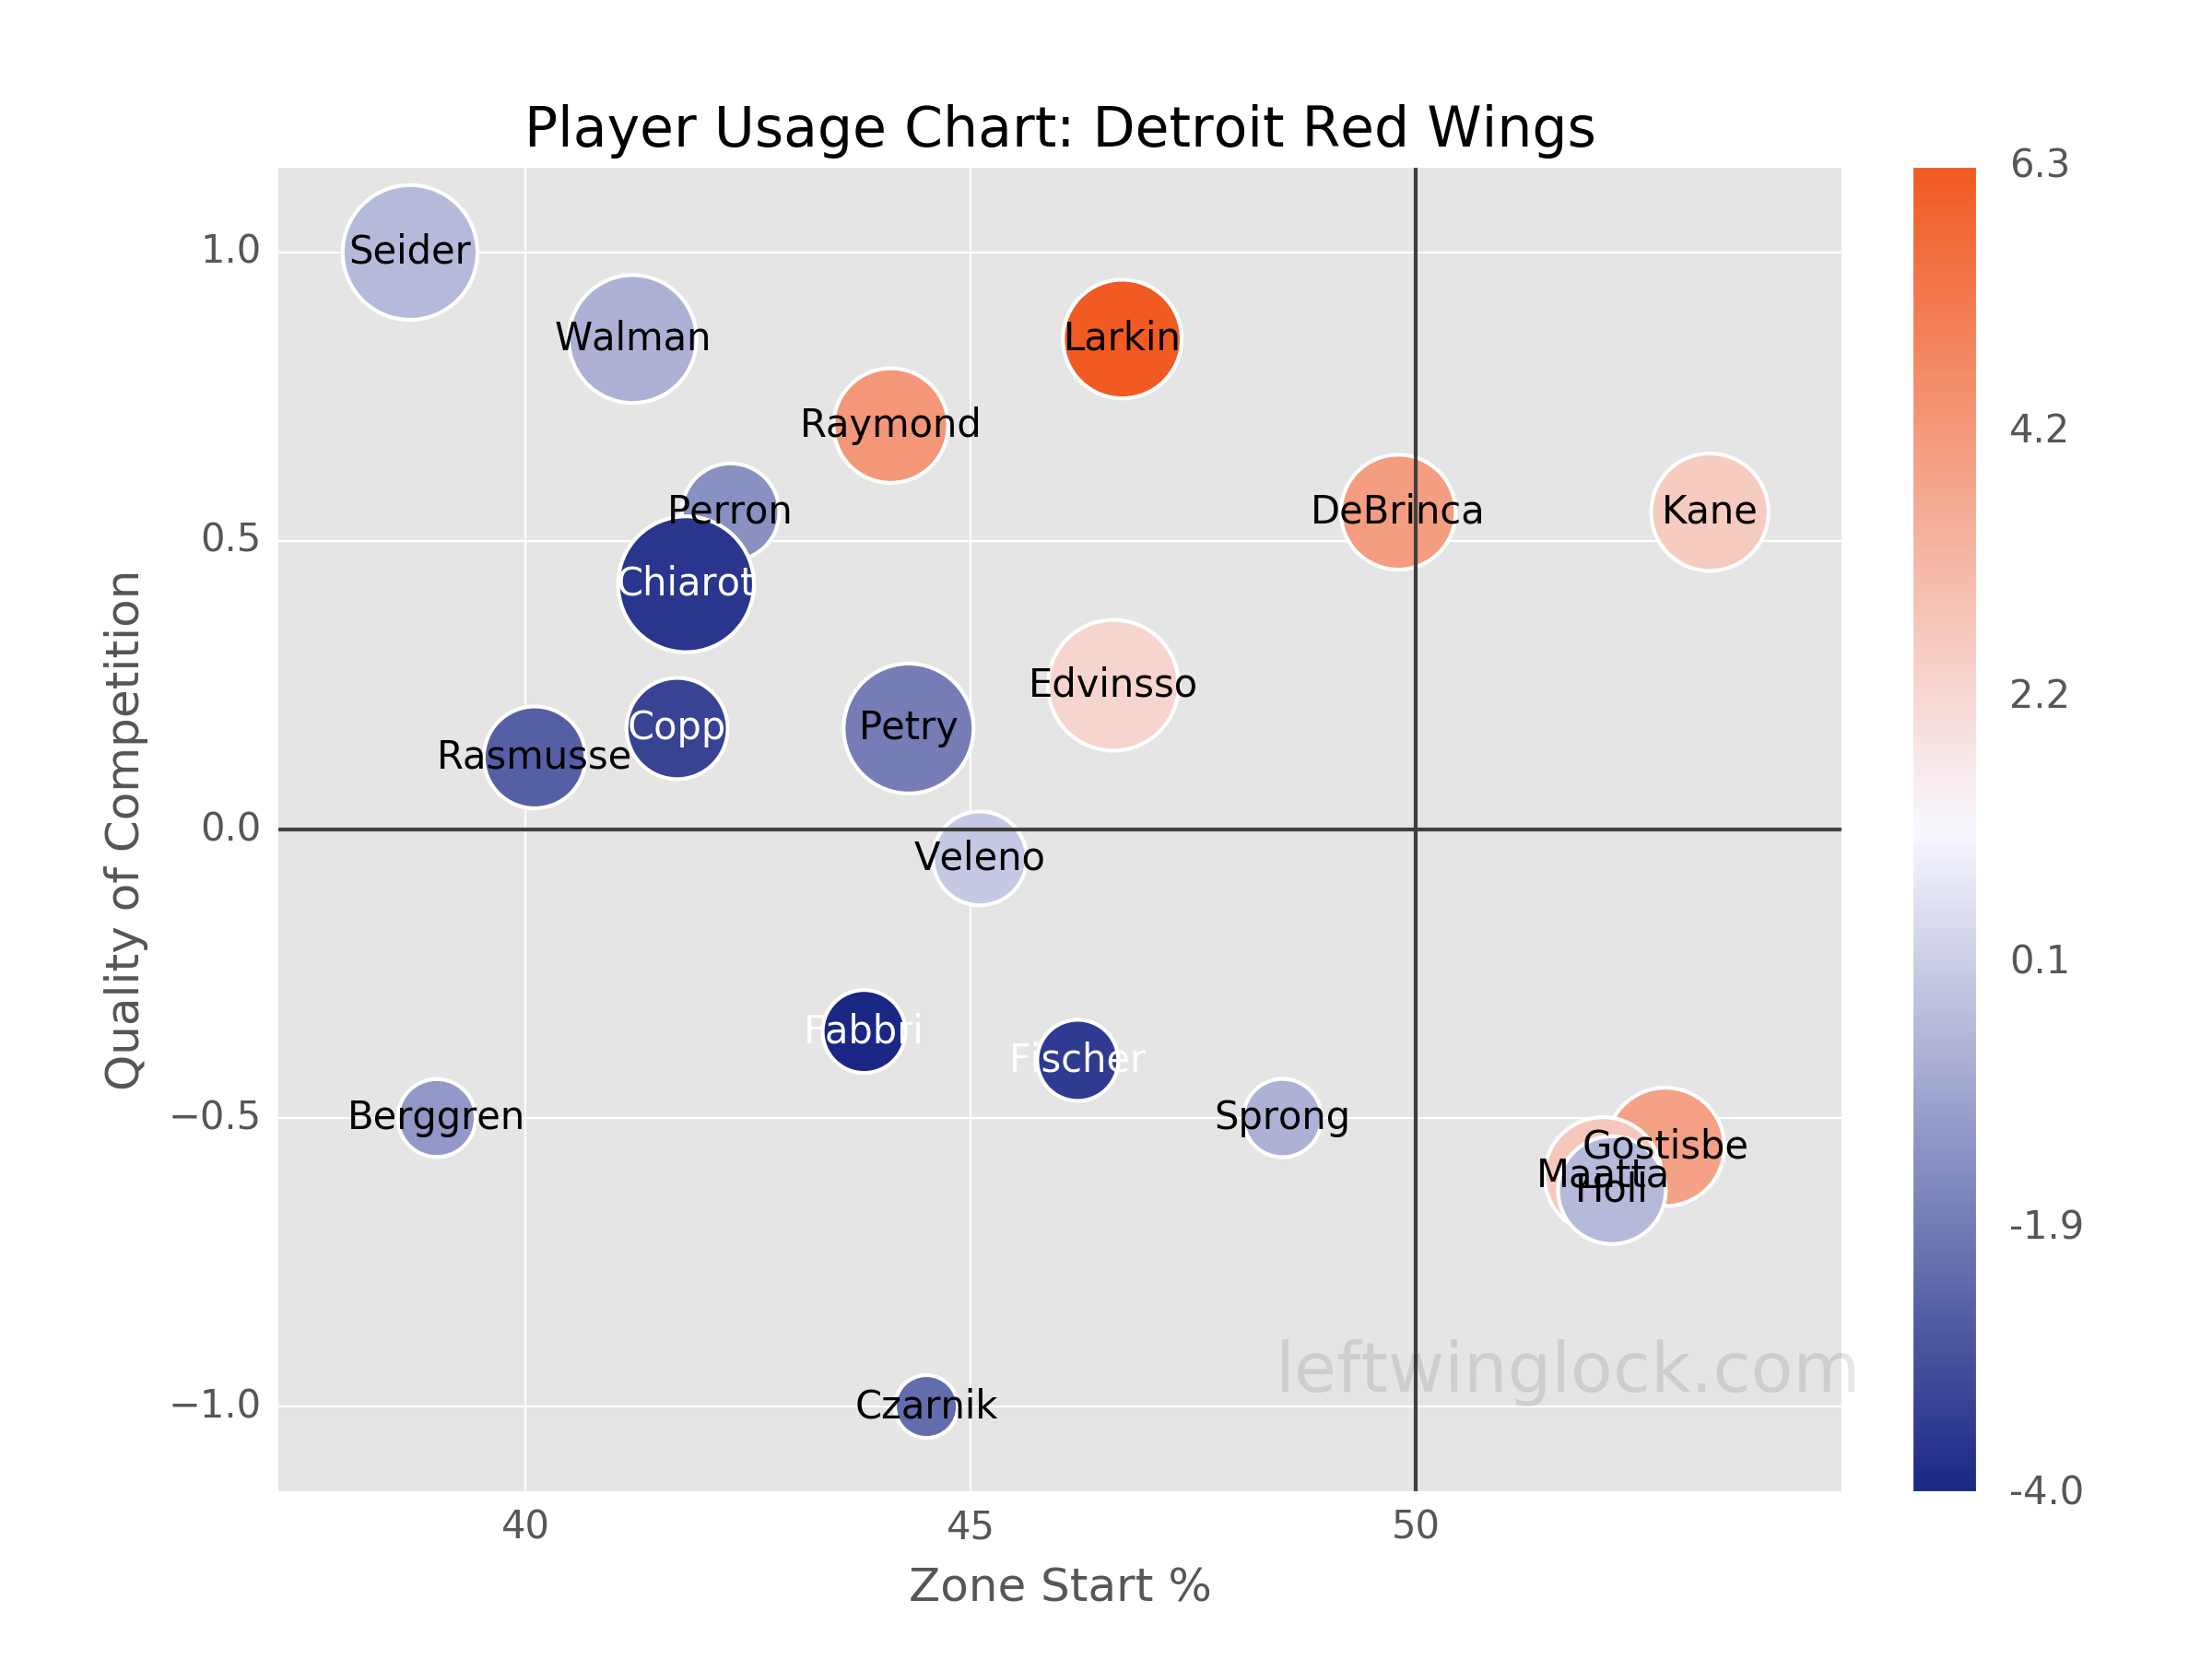
Player Usage Chart / Possession and Luck Chart